
Wednesday Websites We Love | Histography
Fun fact: this website was created by a student as a final project for a class in art school. I’m guessing this person got an A. Histography.io is a comprehensive interactive timeline starting from the beginning of time to today. Every historical event on Wikipedia is pulled into this timeline automatically and self-updates whenever a new historical event is added. Due to its elaborate frontend and backend design, it’s obvious why Histography.io is this week’s Wednesday Website We Love.
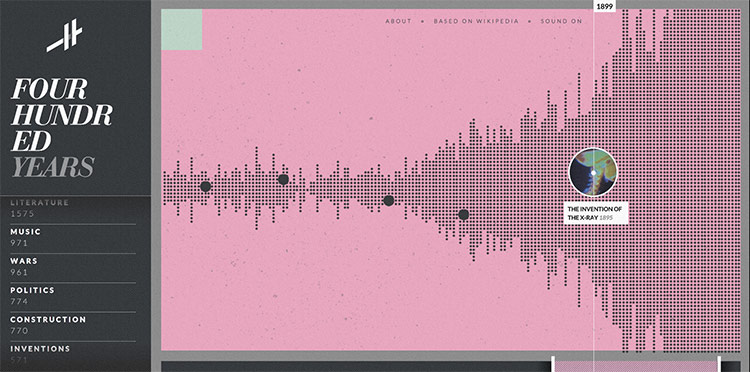
The cool thing about Histography is that you can travel through time simply by clicking on dots. Each dot represents a historical moment in history. Clicking the dot brings up informational links about that event including its Wikipedia page, related events, and sometimes even a video. You can adjust the bar at the bottom to narrow down a specific time period. You can also choose historical events based on subject matter like “Music” or “Wars.”
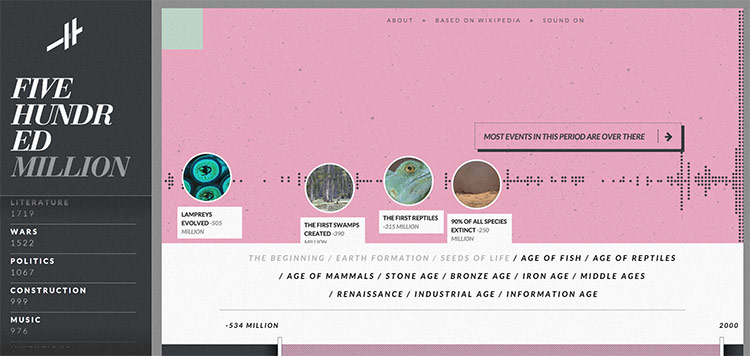
The frontend development of this site is outstanding! Thanks to JavaScript, Histography includes a variety of hover events giving it that cool animated effect. It also includes a remarkable amount of animated gifs that play when you hover over certain dots.

The backend is just as impressive. Histography most likely uses an API to pull data automatically from Wikipedia. This is a great concept to use an API because there will always be history in the making and therefore, this site can continually grow.
So if you’re a history buff or just want learn about history, you have to check out Histography.io. Make sure to turn up the volume, there’s some pretty cool sound effects!
